
 Suche
Suche
 Mein Konto
Important price forecast for TRON: Can the TRX price overcome the crucial golden ratio resistance at USD 0.236?
TRON forecast for Thursday, April 3, 2025: Resistance at the Golden Ratio level The TRON price (TRX) is currently encountering critical resistance at around USD 0.236, which corresponds to the Golden Ratio level. The question remains whether the price can overcome this important resistance and whether a bullish trend will develop. TRON price forecast: Bullish breakout possible? The TRON price is currently showing significant resistance at the Golden Ratio at around USD 0.236. A breakout could lift the price towards the next Golden Ratio level at around $0.25. In the event of a bullish break, a target of .382 Fib level at around $0.296 would be realistic. The MACD lines…

Important price forecast for TRON: Can the TRX price overcome the crucial golden ratio resistance at USD 0.236?
TRON forecast for Thursday, April 3, 2025: Resistance at the Golden Ratio level
The TRON price (TRX) is currently facing critical resistance at around USD 0.236, which corresponds to the Golden Ratio level. The question remains whether the price can overcome this important resistance and whether a bullish trend will develop.
TRON price forecast: Bullish breakout possible?
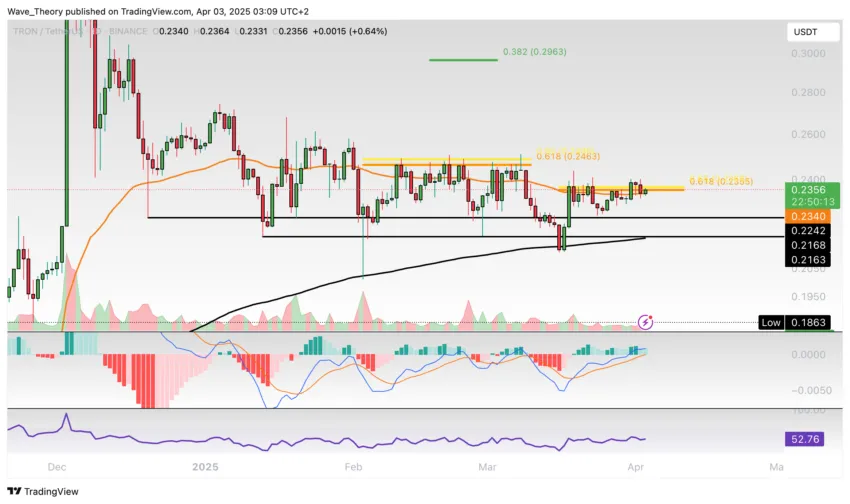
The TRON price is currently showing significant resistance at the Golden Ratio at around USD 0.236. A breakout could lift the price towards the next Golden Ratio level at around $0.25. In the event of a bullish break, a target of .382 Fib level at around $0.296 would be realistic.
The MACD lines and the exponential moving averages (EMAs) continue to show a bullish trend on the daily chart. Meanwhile, the RSI is in neutral territory and the MACD histogram is starting to trend bearish.
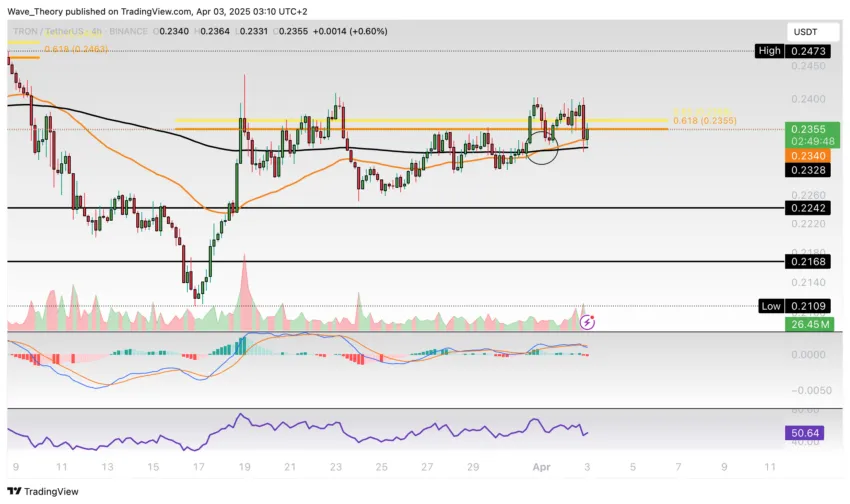
Golden crossover on the 4-hour chart
On the 4-hour chart, the MACD lines have crossed bearishly while the MACD histogram is trending sideways. The RSI remains neutral but does not offer any clear bullish or bearish signals. On the positive side, there has been a golden crossover in the EMAs, suggesting that the short-term trend remains bullish.
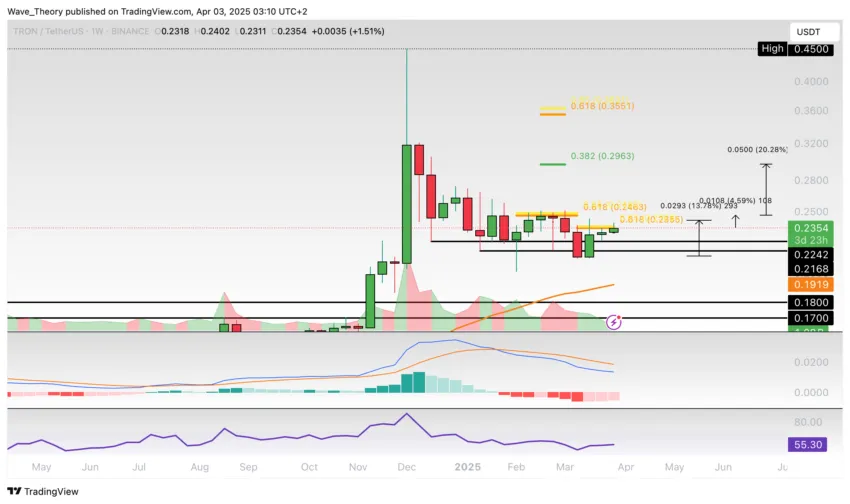
Uptrend: Is a strong increase to be expected?
In the last three weeks, TRON is up about 14%. There could be an upside potential of around 4.6% up to 20% on a rise to the next Fibonacci resistances. The MACD histogram has shown a bullish trend for three weeks, while the MACD lines are still bearishly crossed.
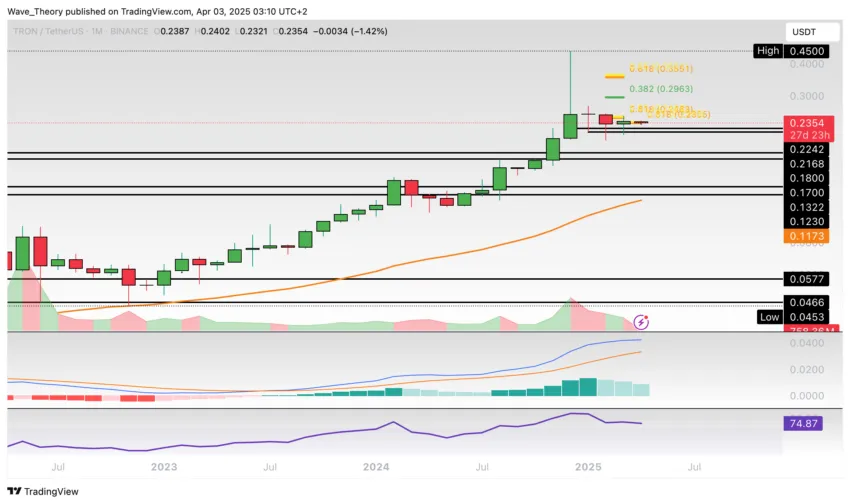
Correction phase for four months
However, it should be noted that the TRON price has been in a corrective movement for four months. The price is still far from the all-time high (ATH) at around USD 0.45. To end the corrective move, TRON needs to break above the Golden Ratio level at around $0.36. Significant resistance is already at the .382 Fib level at around $0.296.
The MACD lines have crossed bullishly, while the MACD histogram has been on a bearish downtrend for three months. The RSI is in overbought regions but shows no signs of bearish divergence.
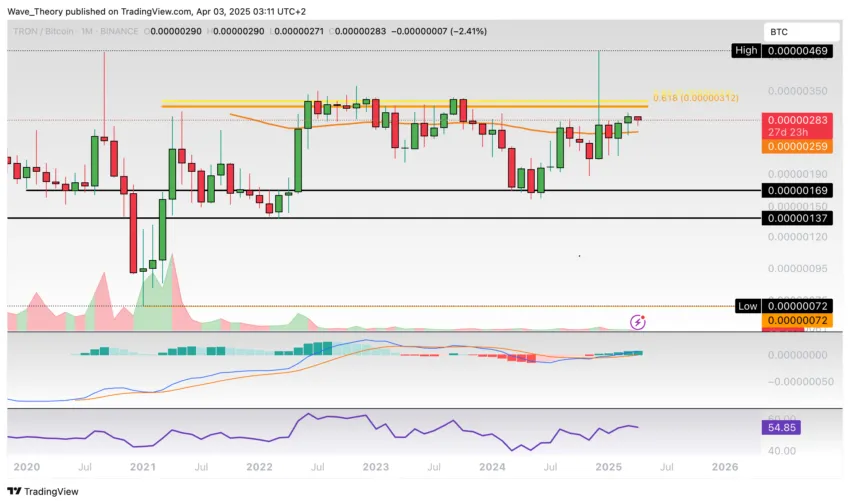
TRON vs Bitcoin: Resistance at Golden Ratio
Against Bitcoin, TRON is again facing significant resistance at around 0.0000032 BTC. The price has already overcome the 50-month EMA at around 0.0000026 BTC. On the downside, significant support awaits between 0.00000137 BTC and 0.0000017 BTC. However, the indicators on the monthly chart show a bullish bias, with MACD lines crossing bullishly and a histogram depicting an uptrend. The RSI remains neutral.
Conclusion
The coming days will be crucial in determining whether TRON can break out of the current resistance. Investors should keep an eye on developments to make informed decisions.