
 Suche
Suche
 Mein Konto
Is $4000 in sight for ETH after a short-term correction?
Key Support Level: $3,600 Key Resistance Level: $3,900 Over the past few days, Ethereum has been consolidating following a correction following the recent rally that saw the price rejected at the key resistance at $3,900. On Sunday, ETH almost fell to the above-mentioned support of $3,600. From a technical perspective, price is unlikely to attempt another push above resistance until bulls have a firm grip on the support area, meaning a more definitive retest is on the cards. If this is the case, we could see a breakout above the key psychological and technical resistance area between $3,900...
Is $4000 in sight for ETH after a short-term correction?
Key Support Level: $3,600
Key resistance level: $3,900
Over the past few days, Ethereum has been consolidating following a correction following the recent rally that saw the price rejected at the key resistance at $3,900. On Sunday, ETH almost fell to the above-mentioned support of $3,600.
From a technical perspective, price is unlikely to attempt another push above resistance until bulls have a firm grip on the support area, meaning a more definitive retest is on the cards. If this is the case, we could expect a breakout above the key psychological and technical resistance area between $3,900 and $4,000 and push towards the all-time high.
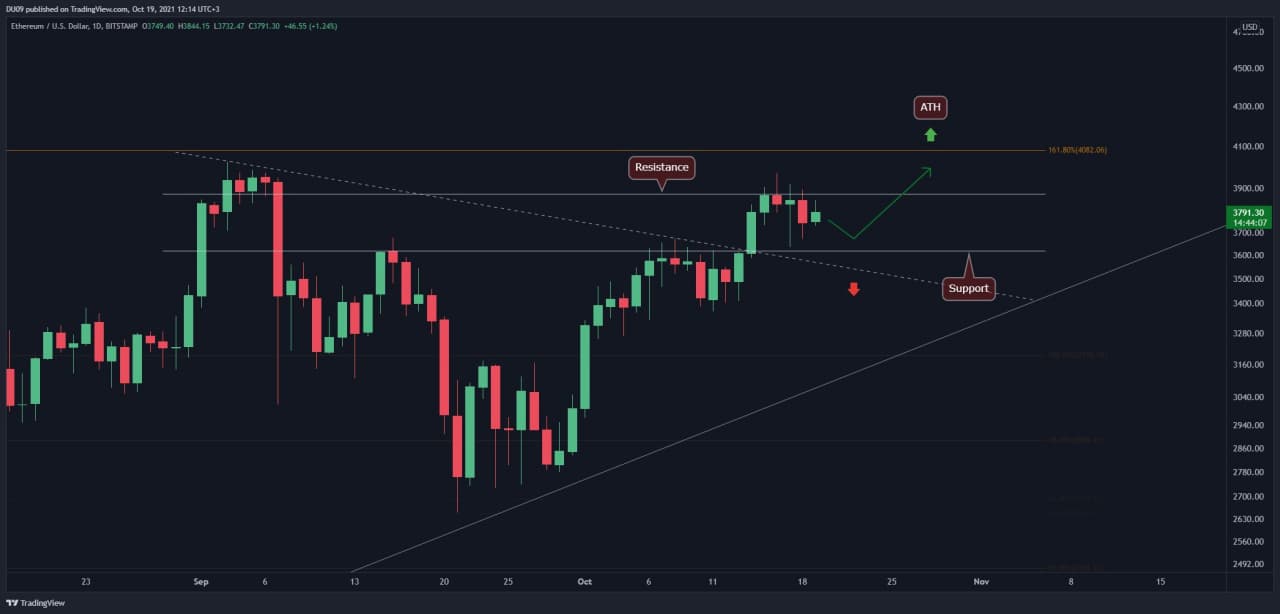 Chart according to TradingView
Technical indicators
Volume:On Monday, volume skyrocketed. However, the bulls were unable to change the momentum as they failed to break the resistance. It is important to keep an eye on volume once the price approaches the important support level. A strong show of force from the bulls at this time will be a good early signal of the price reversal.
RSI:On the four-hour time frame, the RSI is bearish, so it is important to remain cautious and watch out for a possible short-term retracement. On the daily time frame, such price action will be a temporary pullback that should recover quickly on the next upswing.
MACD:The MACD histogram is making lower highs; this is bearish in the short term. As long as the MACD moving averages do not form a bearish cross, the bias for ETH remains bullish despite a bearish histogram.
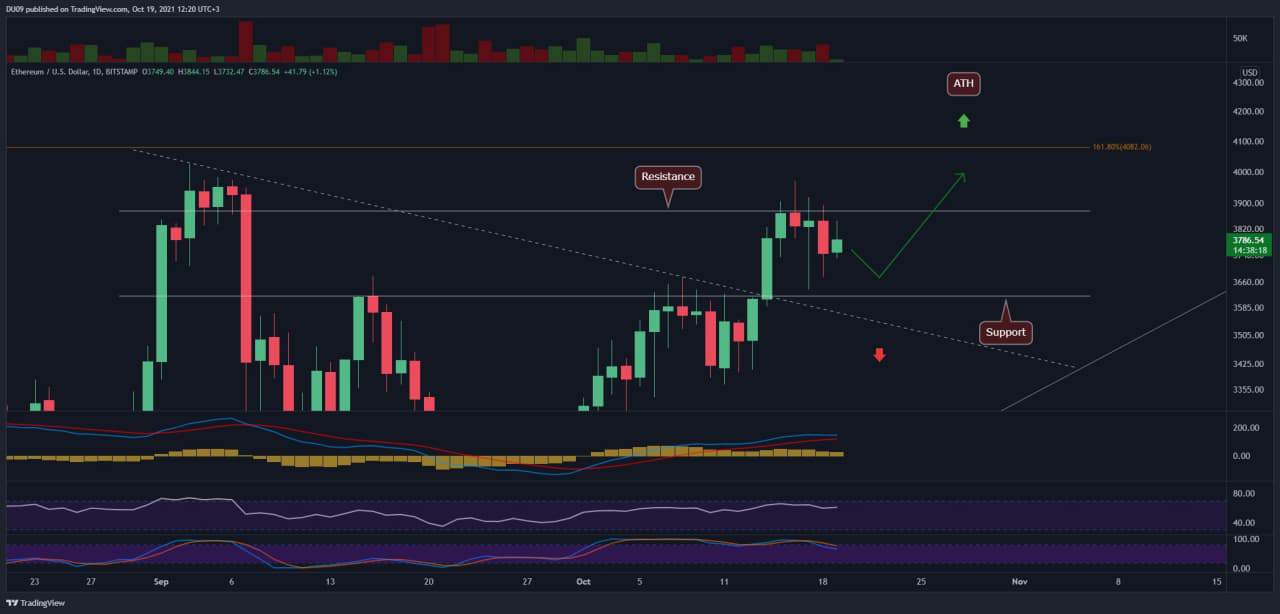 Chart according to TradingView
ETH bias
In the long term, the ETH bias remains very optimistic. In the near term, expect the price to retest the key support level. A good bounce at this level could push ETH back to its all-time high.
Short term price prediction for ETH price
The $3,600 support level remains a very tempting entry for bulls and this will need to be confirmed by price action once it gets there. The key resistance at $3,900 can continue to push ETH lower until bulls gain a firm grip on the price. This would represent an attempt to break the current all-time high of $4,380.
.